Feature
Research Report
Building the Case for Modern Public Sector Messaging


Quick Answer That Defines This Article: The Customer Effort Score (CES) is a customer experience metric that measures how easy or difficult it is for customers to complete a specific task with a brand. Businesses use CES surveys to identify friction across support, purchase and self-service interactions — and to predict whether customers will return or churn.
Customers no longer tolerate friction when interacting with a brand. Whether they are seeking support, completing a purchase or trying to find information, every additional step adds frustration and increases the likelihood of abandonment. Increasingly, effort is not just measured after the fact, but influenced in real time through AI-driven workflows, automation and customer journey orchestration.
This article explains what the Customer Effort Score is, how to measure it, where it fits among other CX metrics and how businesses can use it to identify friction, improve efficiency and strengthen customer loyalty.
The Customer Effort Score (CES) is a customer experience metric that measures how easy or difficult it is for customers to complete a specific task with a brand — whether that is making a purchase, resolving a support issue or navigating a self-service tool. Unlike broader sentiment measures, CES focuses on the immediate experience of a single interaction, making it one of the most actionable signals available to CX teams.
While CES is traditionally captured through surveys, many CX teams now supplement it with behavioral signals such as time to resolution, number of handoffs and repeat interactions. This allows businesses to measure effort not just as perception, but as something that shows up in real operations.
A Verint study found that 44% of Gen Z and 43% of Millennials reported expending more effort than anticipated to complete an interaction, suggesting that younger consumers have especially high standards for digital experiences. To meet these expectations, businesses need to deliver pain-free, low-friction journeys from start to finish.
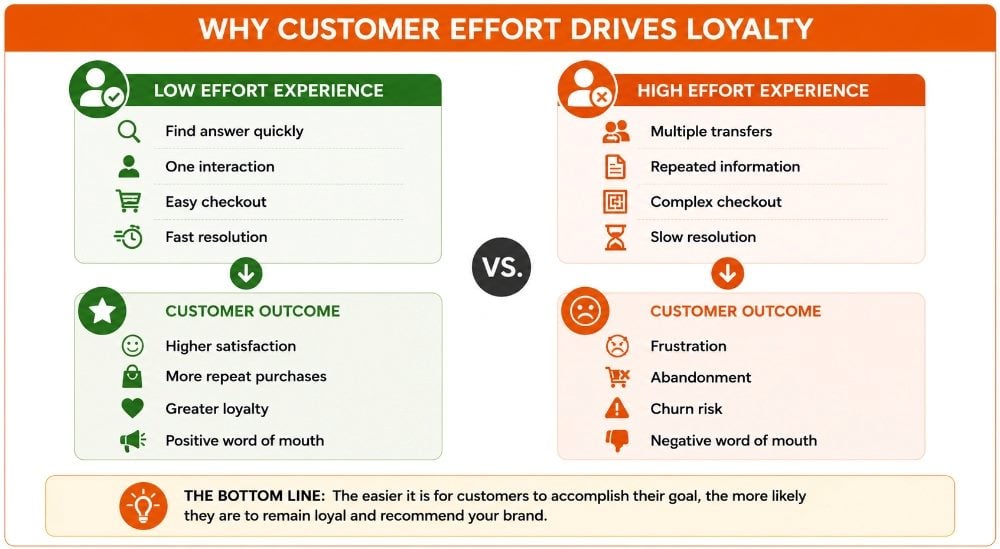
The logic is straightforward: the more effort a customer must exert, the less likely they are to remain loyal. By pinpointing areas where friction exists, CES gives businesses a way to understand how processes, tools, and service channels are actually performing from the customer’s perspective.
“Customers get frustrated when something they want to do with your brand requires a lot of effort, or unexpected effort for them,” said Jeannie Walters, chief experience investigator and CEO at Experience Investigators. “The CES is a way to monitor how much effort customers feel is required of them to accomplish something with a brand.”
While CES provides a clear signal of friction at specific moments, it offers only a partial view of the customer experience when used in isolation. Often, it is used along with other CX metrics such as Net Promoter Score (NPS), Customer Satisfaction (CSAT) and Customer Churn Rate (CCR). Together, they create a fuller picture of the customer journey, with CES offering a sharp lens on ease of use at the most critical moments.
Related Article: The Complete Guide to Customer Journey Mapping
Customers expect consistent, exceptional experiences across every channel, and when they don’t get them, they rarely stay quiet. A checkout process that forces customers to enter their information yet again, a support ticket that takes multiple handoffs, or a website that buries essential information can all erode trust. What feels like a minor friction point to a business can feel like a major frustration to a customer, one that pushes them toward competitors.
Research shows that effort is one of the strongest predictors of customer loyalty. A classic Gartner finding illustrates just how powerful effort can be: 96% of customers who reported a high-effort service experience became more disloyal, compared to only 9% who encountered low effort.
The ripple effects of a low-effort experience extend beyond loyalty and retention. They shape what customers say about you.
According to Qualtrics XM Institute’s 2025 global consumer study, 49% of consumers share a very good experience with friends or family, compared to 45% who share a very poor one. High-effort interactions increase the likelihood of churn and amplify negative word of mouth, extending the impact far beyond a single touchpoint. The lesson is clear: the harder it is for customers to achieve their goals, the less likely they are to return.
At its core, it’s simple: make it easy for customers to spend their money.
The CES was created to address this challenge. It offers a direct way to measure how easy or difficult it is for customers to complete a task, giving businesses the data they need to identify friction and improve experiences before they drive people away.
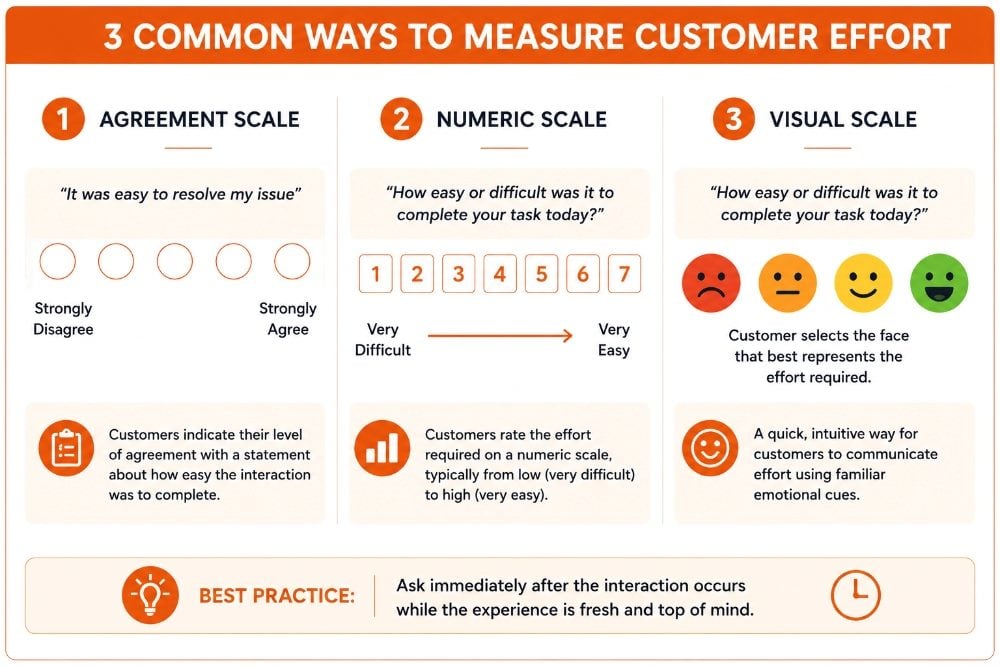
CES surveys are typically deployed right after a meaningful interaction — completing a purchase, resolving a support issue or using a self-service tool. Asking customers while they are still in the moment keeps feedback closely tied to the actual interaction. There are three common survey formats:
Some businesses add visual variations such as stars, sliders or color coding, but the most important principle is clarity. The easier it is to respond, the more accurate and useful the results will be.
At the same time, CES surveys are increasingly paired with passive data from digital analytics, session tracking and interaction logs. These signals help validate whether reported effort aligns with actual customer behavior.
Effective CES questions are specific, task-focused and easy to answer quickly. The best questions name the interaction being evaluated, use a consistent scale and avoid compound phrasing that asks customers to evaluate more than one thing at a time.
Here are examples across common formats:
Pairing a scored question with an open-ended follow-up increases the diagnostic value of CES data. Effective follow-up prompts include:
According to Walters, brands can also include open-ended follow-up questions at the end of a CES survey to ask for feedback on the response. Prompts such as asking the reason for the score or what would improve the experience will encourage customers to provide specific information.
Related Article: How to Use AI to Actually Reduce Customer Effort
Calculating CES is straightforward: add up the total of all customer ratings and divide by the number of responses.
For example, if 50 customers rate an interaction on a 1–10 scale and their scores total 400, the CES would be 8 out of 10.
The exact numbers will vary depending on the scale used (1–5, 1–7, or 1–10), but consistency matters more than the range itself. Using the same scale over time makes it easier to track trends and see whether customer effort is improving or slipping.
Many businesses now integrate CES into real-time dashboards alongside operational metrics, allowing teams to identify friction as it emerges rather than relying solely on post-interaction feedback.
There’s no universal benchmark for a “good” Customer Effort Score. It depends on the scale you use, the industry you’re in and the expectations of your customer base. For instance, an ecommerce business might consider a CES of 5 on a 1–7 scale to be strong, while a financial services firm handling sensitive transactions may need consistently higher ratings to be competitive.
Customer Effort Score benchmarks vary by industry due to differences in customer expectations, complexity of interactions and regulatory requirements. The ranges below provide a general reference point for evaluating CES performance across common sectors.
| Industry | Typical CES Scale | Good CES Benchmark | Interpretation |
|---|---|---|---|
| Ecommerce | 1–7 | 5.0+ | Effortless checkout and quick resolution are expected |
| SaaS/Tech | 1–10 | 8.0+ | Easy onboarding and self-service drive higher scores |
| Financial Services | 1–5 | 4.0+ | Security and clarity are critical for customer confidence |
| Telecom | 1–7 | 5.5+ | Fast issue resolution and service reliability are key |
Benchmark ranges are general reference points based on commonly reported industry data. Scores reflect typical performance on each sector's most commonly used scale. Your ideal benchmark will vary based on customer expectations, interaction complexity and competitive context. Last reviewed: May 2026.
As Daniel Rodriguez, CEO at Currently Wine Co and former CMO at Simplr, reiterated, the real value comes from tracking CES over time rather than fixating on a single score. Trends reveal whether your improvements are reducing friction or whether new issues are creating added effort.
A practical benchmark is a 10% quarter-over-quarter improvement, which can signal progress in reducing effort when measured consistently over time. On the other hand, sudden drops in CES often point to process failures, product issues, or service breakdowns that require immediate attention.
To make interpretation easier, many CX teams create industry-specific benchmarks or compare CES across key journey stages. This helps put individual scores in context and ensures that effort is being reduced where it matters most. The value of CES isn’t in the score itself, but in how quickly teams can act on it to remove friction from workflows, interfaces and service processes.
Like any CX metric, CES has strengths and limitations. On its own, it offers useful insights, but it’s most effective when paired with other data. As Walters emphasized, “Customer experience management and leadership requires reviewing measurements like CES and NPS to improve the customer experience, as well as listening to the feedback, understanding operational data and relying on a CX strategy to move a business forward. Tracking numbers is never enough.”
Many brands have found these benefits associated with CES:
Shopping experiences are relative, but standardized metrics such as CES quantify the variables involved. By asking users about their experience through the lens of effort, a business can understand just how easy it is for a customer to make a purchase, ask a question or troubleshoot a problem, according to Rodriguez.
“In the era of the ‘NOW Customer,’ website visitors expect quick resolutions or risk jumping to a competitor’s site,” he said. “Measuring customer effort is an important way to ensure today’s consumers are having the best experience possible.”
Measuring CES across the customer journey helps CX leaders identify high-effort areas and take action to improve experience and revenue outcomes, Rodriguez said.
Probably not; there are also important limitations to keep in mind:
While the CES is undeniably useful, it's crucial to use it as part of a broader suite of customer experience metrics. By understanding its limitations, you can interpret CES data in context and make more informed decisions about how to improve your customer experience.
Each CX metric captures a different dimension of the customer journey, and the strongest insights come when they’re used together.
The Customer Effort Score is useful for following a specific touchpoint or transaction, such as interactions with customer support agents. It's also a useful tool for prioritizing customer journey improvements, said Walters.
You might deploy a CES survey at key points along the journey, she added. “If payment process is showing a low CES, that is an important thing to know. It's also good for self-service options like finding answers in a knowledge base or solving an issue.”
When you have a high-effort service interaction, customer loyalty can take a hit. If you’re looking to optimize specific customer interactions and make a product or service more user-friendly, CES should be your go-to metric.
Unlike capturing data on one specific moment or interaction, the Net Promoter Score is a good metric for those long-term customer loyalty questions and relationships. It's measured by the customer's experience as a whole, including the product attributes, price, brand and customer service altogether, Rodriguez explained.
When combined, he said, “Customer Effort Score and NPS can build a more complete view of customer sentiment.”
The Customer Satisfaction Score measures the degree to which a customer is happy with your product, service, or a specific interaction they’ve had with your company. Like CES, CSAT is measured using a simple survey where customers rate their satisfaction on a scale, such as 1 to 5 or “very dissatisfied” to “very satisfied.”
It’s essential to remember that CSAT scores are a broad measure of customer satisfaction. It may not provide detailed insights into specific aspects of the customer experience, which is where CES can come in handy.
The Customer Churn Rate is a key metric that reveals the percentage of customers who stop using your product or service over a given period of time. It’s an important indicator of customer satisfaction, product-market fit and customer loyalty.
While churn tells you customers are leaving, it doesn’t tell you why. That’s where CES becomes invaluable. By using CES alongside CCR, you can start to understand if customer effort impacts your churn rate.
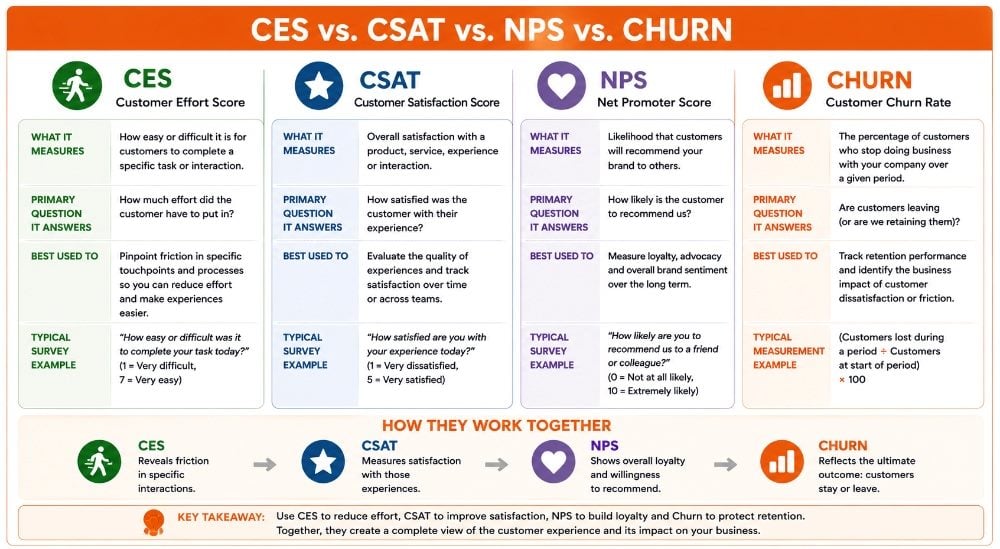
Customer Effort Score is most effective when used alongside other CX metrics. Each metric captures a different dimension of the customer experience, helping businesses understand both perception and outcomes.
| Metric | Primary Focus | Best Used For | Limitations |
|---|---|---|---|
| Customer Effort Score (CES) | Ease of completing a specific task or interaction | Pinpointing friction in support, purchase or self-service | Does not capture emotional context and focuses on single touchpoints |
| Net Promoter Score (NPS) | Likelihood to recommend and overall loyalty | Measuring long-term brand relationship and sentiment | Does not identify specific friction points |
| Customer Satisfaction (CSAT) | Immediate satisfaction with a product, service or interaction | Capturing quick feedback on recent experiences | Less diagnostic and may not predict long-term loyalty |
| Customer Churn Rate (CCR) | Percentage of customers lost over time | Assessing retention and overall business health | Outcome metric and does not explain why customers leave |
When combined, these metrics provide a more complete picture of CX health. CES pinpoints friction, CSAT and NPS highlight sentiment and loyalty, and churn confirms whether those experiences are impacting retention. Used together, they give CX leaders both the “what” and the “why” needed to improve outcomes.
Improving your Customer Effort Score isn’t about one-time fixes, it requires building low-effort experiences into every interaction. Leading businesses today are combining foundational practices with new AI-driven capabilities to minimize friction and deliver smoother interactions.
Eliminate unnecessary steps in onboarding, checkout and payment flows — every redundant click or unclear navigation element adds measurable effort. Regularly audit your customer journey to identify policy barriers and friction points before customers encounter them.
Deploy agentic AI and predictive routing to help customers resolve issues faster, while equipping human agents with AI copilots that suggest next-best actions — so speed and empathy work together rather than in competition.
Reduce perceived effort through intuitive UX design — prioritize multi-language support, accessible layouts and personalization that anticipates customer needs before they have to ask. Regular usability testing ensures the digital experience stays aligned with evolving customer experience expectations.
Some businesses have already shown how to use CES as a driver of real change.
Anna Koval, co-founder and CMO at Tarotoo, described how her team raised CES by simplifying the digital experience. "We simplified our website and app design, making it easy for our customers to find, book and enjoy our tarot reading services, and optimized our website and app performance, ensuring that they load fast, run smoothly and work seamlessly across all devices and browsers," she said. "By making our CES better, we have made our CX and customer loyalty better, too. Our customers are happier with our services, more likely to tell others about us and more eager to come back to us."
Send timely notifications about delays, outages or changes before customers contact support — paired with clear next steps that remove uncertainty and reduce unnecessary inbound volume. Proactive customer support reduces anxiety and strengthens trust before frustration has a chance to build.
Give customers the tools to resolve issues on their own terms — robust knowledge bases, AI-powered chat and video tutorials that match the complexity of your most common support requests. The more effective your self-service, the higher your CES.
Connect CES survey data to operational metrics in real-time dashboards and feedback loops so teams can distinguish which changes are reducing effort and which are introducing new friction — turning CES from a lagging indicator into an active improvement signal.
As Max Gomez Montejo, CMO of SEO service The HOTH, explained, "Getting transparent CES ratings from your customers provides a pile of first-party data that you can put into action immediately, and you'd be remiss not to." He suggested that when customers see small changes resulting from their input, their perception of effort shifts dramatically. They stop comparing you to competitors and instead compare you to "the old you," strengthening loyalty without major cost.
Yes. High-effort interactions are strongly associated with disloyalty. Research from Gartner found that 96% of customers who reported a high-effort service experience became more disloyal. Used alongside Customer Churn Rate, CES can help identify which friction points are driving customers to leave before churn data confirms it.
CES measures ease of completing a specific task at a single interaction. NPS measures overall loyalty and likelihood to recommend across the full customer relationship. CES is diagnostic and touchpoint-specific; NPS is relational and longitudinal. Both are most useful when tracked together.
There is no universal benchmark. A good CES depends on your scale, industry and customer base. On a 1–7 scale, scores above 5.0 are generally considered strong in e-commerce; financial services firms typically aim for 4.0+ on a 1–5 scale. More important than any single score is the trend — consistent quarter-over-quarter improvement signals that friction is being reduced.
CSAT measures how satisfied a customer is with a product, service or interaction — it captures sentiment. CES measures how much effort a customer had to exert — it captures friction. CSAT tells you whether customers are happy; CES tells you whether your processes are getting in their way.
Deploy CES surveys immediately after a meaningful interaction — a support resolution, a completed purchase or a self-service attempt. Timing matters: feedback collected within minutes of an interaction is more accurate and actionable than feedback gathered days later.
Customer Effort Score is a straightforward but powerful way to see your brand through the customer’s eyes, revealing where friction undermines loyalty and where simplicity strengthens it.
On its own, it highlights ease of use, but when paired with metrics such as NPS and CSAT, CES becomes part of a complete toolkit for building experiences that keep customers engaged and coming back.
As AI becomes more embedded in customer journeys, CES is evolving from a feedback metric into a diagnostic signal for identifying friction across systems, workflows and decision-making processes.