Editorial
On-Demand Webinar
Do More with Less: Modernizing the Cloud Contact Center

By 2025, Gartner predicts 80% of organizations will be using generative AI for customer service. McKinsey reports early adopters are already seeing a 20% performance boost within weeks of using AI. And researchers have found generative AI can lift agent productivity by 15%, on average.
Clearly, the AI chatbot revolution is underway. But here’s the catch: fluent, fast answers don’t guarantee trustworthy ones.
When chatbots handle policy queries, performance benchmarks or internal advice, being “mostly right” isn’t enough. In enterprise settings, a hallucinated response can mislead a customer, derail a decision, or breach compliance. Yet most chatbot analytics today still track outdated metrics: session counts, intent fallback rates or escalation frequency.
That’s not good enough in the generative AI era.
Large language models (LLMs) powering today’s chatbots work by generating language patterns based on content retrieved from internal knowledge bases (known as Retrieval-Augmented Generation, or RAG. But even with high-quality content, LLMs can still hallucinate—filling gaps with confident but fabricated answers when content is missing or ambiguous.
This isn’t just theoretical. During early testing of our own AI chatbot, Dr. SWOOP, we saw:
These weren’t bugs. They were symptoms of missing content, fuzzy prompts or a lack of system guardrails. To move forward, we realized we needed a new layer of analytics: one that could expose these weaknesses, trace content usage and rate the trustworthiness of every response.
Related Article: Preventing AI Hallucinatons in Customer Service: What CX Leaders Must Know
As an analytics company, we asked ourselves the questions most chatbot developers eventually face
We didn’t want to rely on surveys or guesswork. We wanted hard data from chatbot conversations; at scale.
We analyzed more than 950 conversations with Dr. SWOOP across a three-month testing period. This included 1,393 questions, with almost 30% being follow-ups, a strong indicator of deeper engagement or unresolved queries.
We focused our analysis across three layers:
We used AI to categorize questions, with seven content themes emerging:
We then scored each question for
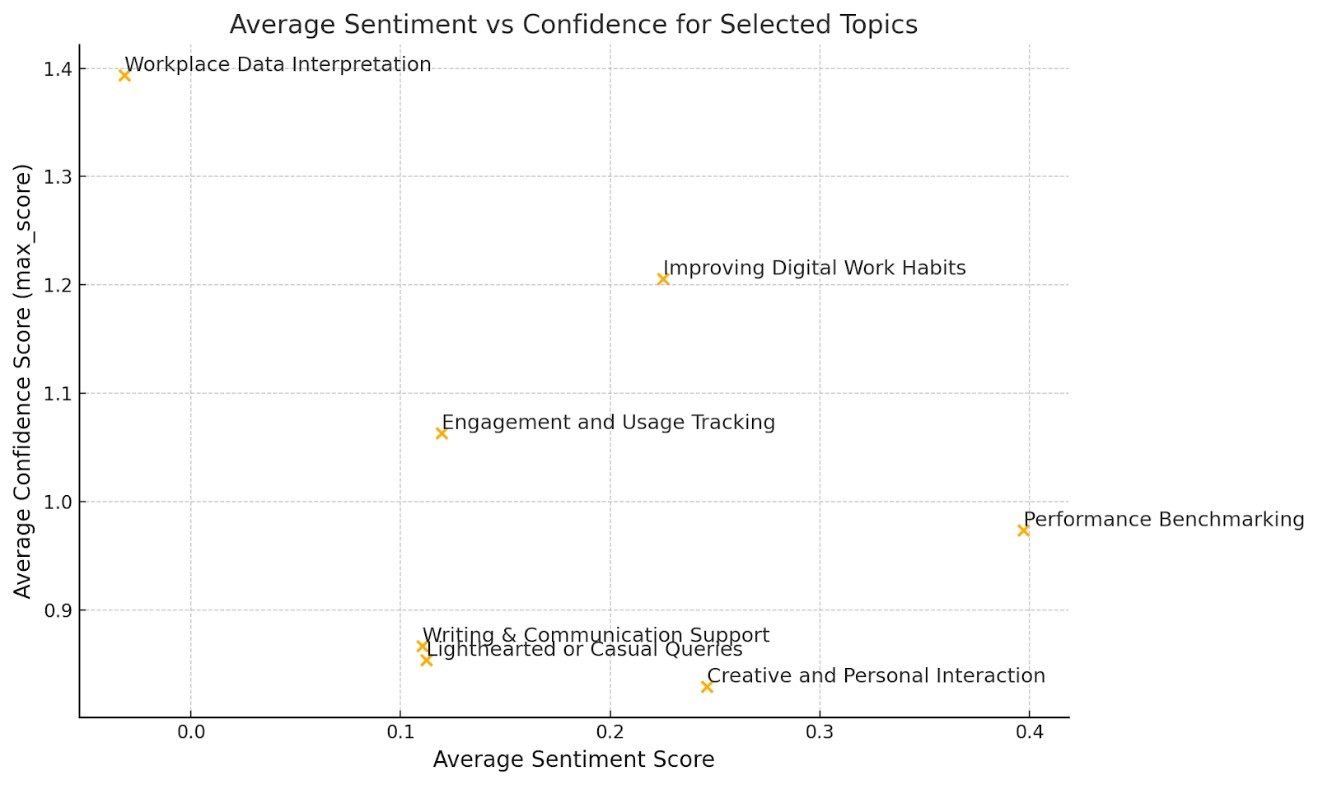
Questions in the “Workplace Data Interpretation” category had high confidence but low sentiment, often asking things like; “My curiosity score is 23%. Is that good?” Lower sentiment scores are not always negative; e.g. direct, succinct language can receive low sentiment scores.
On the other hand, “Light-hearted” or “Creative” queries had low confidence, indicating a risk of hallucination and possible content gaps. But was this damaging or not in these contexts? We had to review the underlying questions to assess this.
It was welcoming to see our customers being so positive about benchmarking their performance against others. But we still have work to do to improve confidence levels in this category.
The power of RAG is that you can trace exactly which documents were used to support each answer.
We sorted documents into four zones:
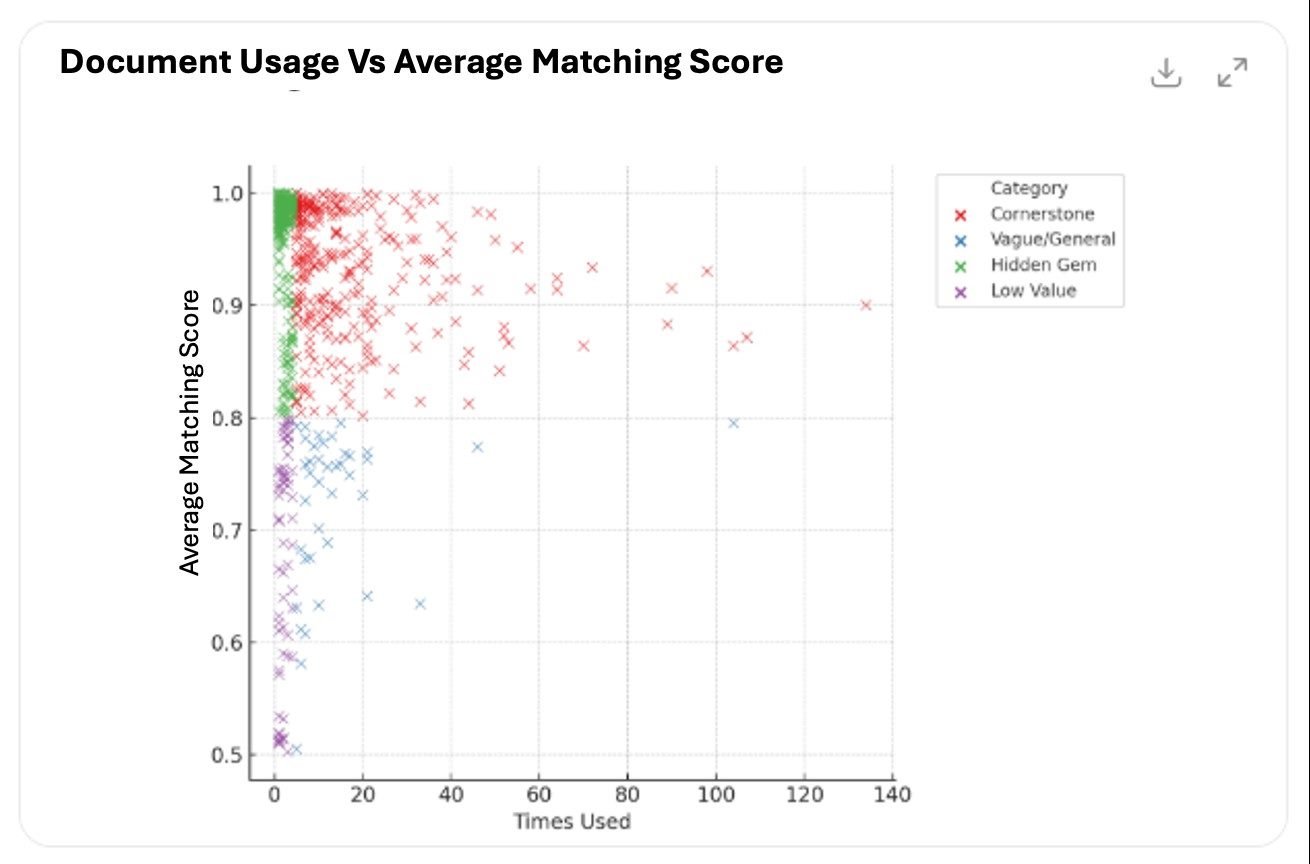
This gave us a roadmap for curating our content repository. This is not based on assumptions, but real-world usage.
Rather than rely on text matching techniques alone, we chose to use AI to look for conceptual overlaps as well. Documents with overlapping content is not necessarily harmful, unless the overlap risks conflicting advice being generated.
We visualized these similarities using a network map graph to show overlaps and clusters:
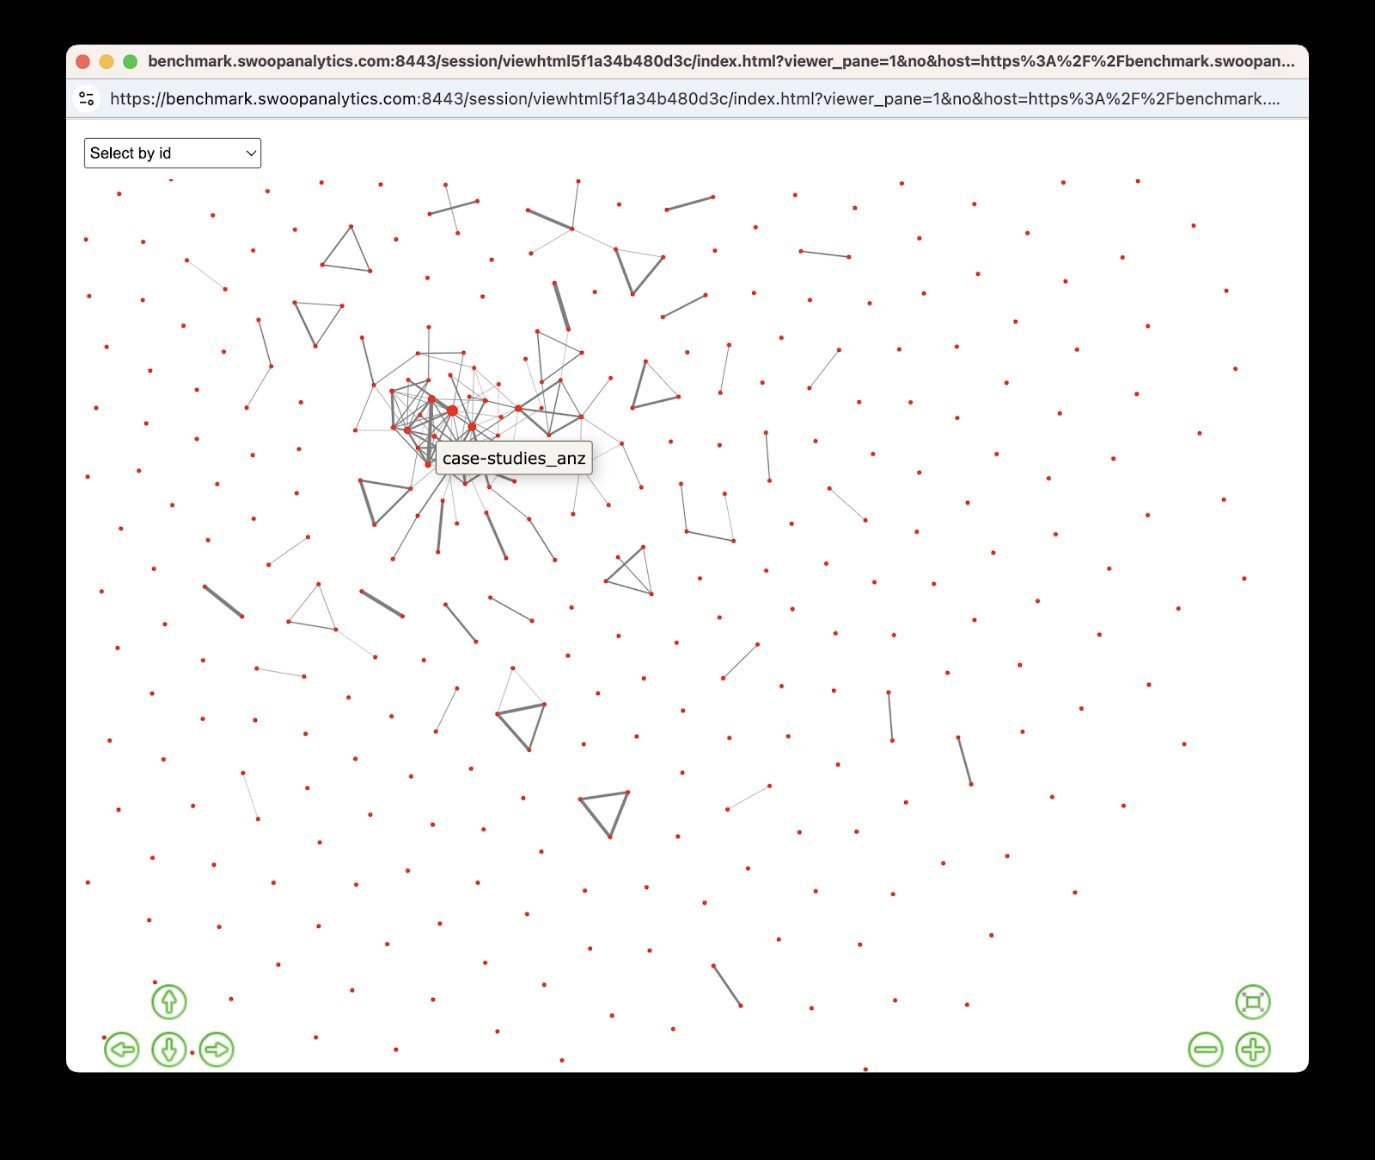
This helped us spot:
Static FAQs are dead. The future of chatbots lies in conversation threads; multi-turn dialogues where users refine their question based on each response.
These threads tell us more than one-shot questions ever could.
We found:
This shows follow-up questions aren’t failures; they’re signals of active exploration. Monitoring thread trajectories could allow for proactive escalation before a user drops out in frustration.
Here’s where standard chatbot dashboards fall short, and where generative AI chatbots demand better:
| Metric Type | Traditional Bots | GenAI Chatbots Need |
|---|---|---|
| Usage | ✓ Sessions, messages | ✓ Plus multi-turn thread quality |
| Intent Match | ✓ Fallback rates | 🚫 Obsolete in LLMs (no intent model) |
| Answer Quality | 🚫 Not measured | ✅ Accuracy, grounding, confidence |
| Content Effectiveness | 🚫 Basic (FAQ hits) | ✅ Source usage and coverage gaps |
| Hallucination Tracking | 🚫 Not supported | ✅ Essential for GenAI |
| Sentiment & Frustration | 🟡 Inferred or ignored | ✅ Direct emotional insight |
| Resolution Funnel | ✓ Escalation tracking | ✅ Add "why" the user escalated |
| Trust & Compliance | 🚫 Not addressed | ✅ Critical for enterprise adoption |
At SWOOP Analytics, we’ve now built analytics to fill these gaps:
As AI chatbots take on more serious roles — resolving complaints, advising on internal policies, delivering business guidance — you need to be sure their answers are:
That’s not just about accuracy, it’s about trust.
The first wave of AI chatbot adoption is already delivering cost savings and speed improvements. But as more businesses put GenAI bots in front of customers and employees, the focus must shift to quality.
That’s why we believe AI chatbot analytics is the next frontier. Not just to monitor usage; but to answer the most important question of all: Can we trust what the bot just said?
If you’re building GenAI bots today, make sure your analytics are ready for tomorrow.
 Learn how you can join our contributor community.
Laurence Lock Lee is the co-founder and chief scientist at Swoop Analytics, a firm specializing in online social networking analytics. He previously held senior positions in research, management and technology consulting at BHP Billiton, Computer Sciences Corporation and Optimice. Connect with Laurence Lock Lee: 
