Feature
Research Report
The 2026 State of CX Outsourcing

Increasingly, websites are evolving into ecommerce platforms. This shift alters the role of analytics platforms from simply being diagnostic tools or means for measuring page views to vital instruments for tracking sales revenue. Let’s take a moment to discuss Google Analytics reports.
To accommodate this expanded role, Google has launched new ecommerce-focused reports in Google Analytics 4: the Checkout Journey report and the Purchase Journey report. These reports measure the consistency of sales completion on websites or apps. Businesses of all sizes, from small retailers to solo entrepreneurs, can now gain insights into customer experience based on the success of their product and service purchases.
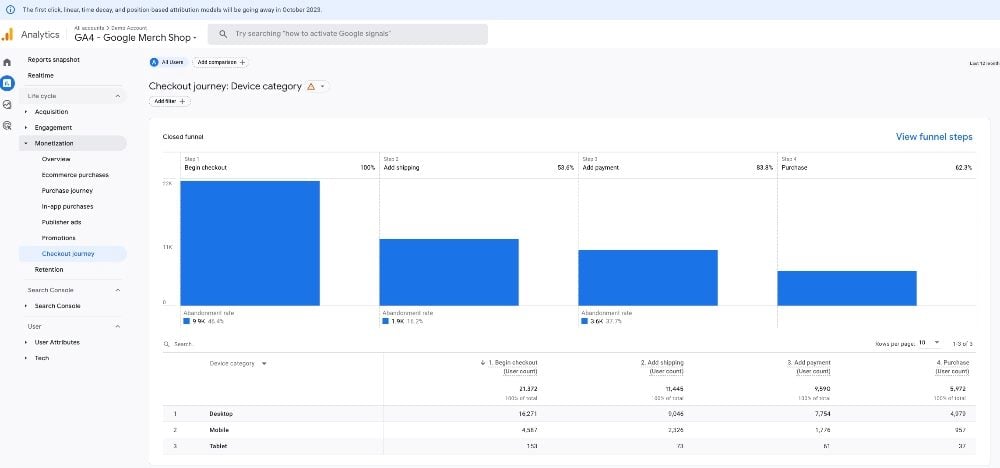
The Google Checkout Journey report can be found under the Monetization category within the Reports section of the Google Analytics 4 menu.
The checkout flow represents the steps a website visitor or app user takes, showing the number and percentage of users who initiate the checkout process on an ecommerce site or app and then complete each following step. The Google Analytics report displays these metrics, providing insights into both the number and percentage of users who start and complete each phase of the checkout process.
Related Article: It's a New Era of Google Analytics Reporting. Are You Ready?
Analysts configure the checkout flow via the Funnel Steps menu. This menu includes four key steps: "Begin Checkout," "Add Shipping," "Add Payment," and "Purchase." These steps correspond to four specific collection events.
begin_checkout for the “Begin Checkout” step.
add_shipping_info for the “Add Shipping” step.
add_payment_info for the “Add Payment” step.
purchase for the “Purchase” step.
The Google Analytics setup closely resembles how conversions are configured in GA4. The steps can be viewed and modified at any time.
The events are mapped to dimensions, with the default view displaying the flow by device type, such as mobile or desktop. However, the report can also be configured to show other dimensions, including Browser, Country, Region, City, Language, Age and Gender.
The report provides analysts with a closed-funnel visualization of the checkout flow. A closed funnel exclusively measures users who complete each step in a given process. In this case, the metrics specifically reflect activities related to the checkout.
The report categorizes the selected dimension as a variable, indicating which visit led to the initiation of the "Begin Checkout" step, the "Add Shipping" step, the "Add Payment" step, or the "Purchase" step.
Related Article: 8 Google Analytics 4 Features That Leave Universal Analytics in the Dust
The Purchase Journey report also offers insights into shopper drop-offs at each stage of the funnel, albeit with less granularity during checkout compared to the Checkout Journey Report. It is designed to complement the Checkout Journey report in identifying optimization opportunities. The Purchase Journey report is also located in the Monetization section of the menu.
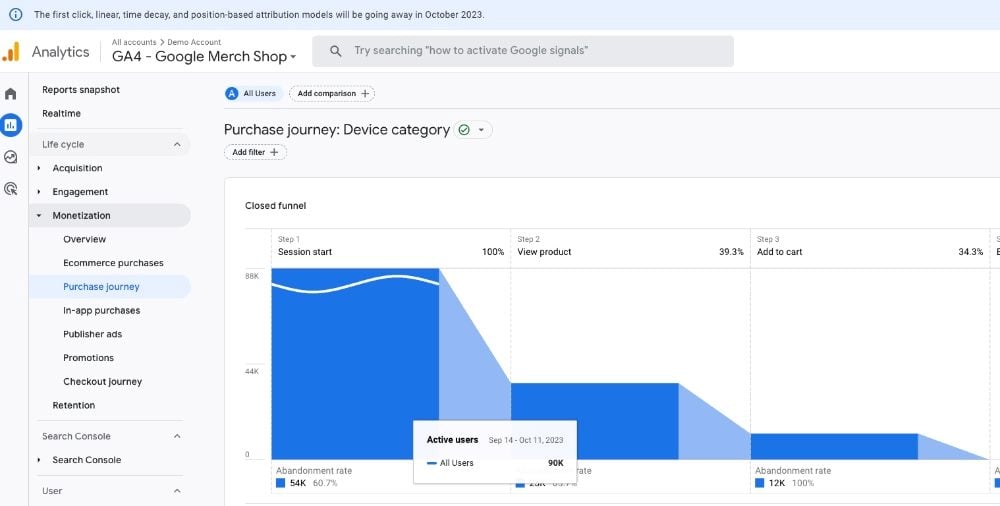
The Google Analytics Purchase Journey report has a setup similar to the Checkout Journey report, but with some distinctions in events and dimensions. The events collected in this report focus on "browsing" steps within a site or app, rather than the checkout process featured in the Checkout Journey report. Three specific events are triggered:
session_start, for marking the start of a session.
view_item, triggered when a product is viewed.
add_to_cart, initiated when an item is added to the shopping cart.
Two events, "begin_checkout" and "purchase" (or "in_app_purchase"), function in the same manner as they do in the Checkout Journey report.
The dimensions are the same as the Checkout Journey, save for age and gender.
The report displays the abandonment rate, which is the percentage of users retained from one step to the next in the purchase funnel. This abandonment rate is shown below each bar in the Purchase Journey report that corresponds to a subsequent step in the funnel.
Related Article: Google Analytics: 4 Tips to Transition from Universal Analytics
The Checkout Journey and Purchase Journey reports effectively replace the flow report, a Sankey visualization in Universal Analytics that displayed the percentage of visitors who would abandon a page progression from the main website to the purchase page.
However, the flow report calculates its metrics based on the number of pages, requiring users to understand their website and make assumptions about visitor behavior on specific pages. In contrast, both the Checkout Journey and Purchase Journey reports align reporting dimensions with events, offering greater precision in tracking the path to conversion. Consequently, attributing sales activity on an app or website is not reliant on how a particular page is loaded in a browser or called within the app code.
Related Article: Your GA4 Is Now Live: Essential Next Steps Smart Marketers Should Take
The Google Analytics Checkout Journey report comes as brands recalibrate their strategies to align with shifts in customer retail behavior that have occurred since the pandemic.
Insider Intelligence (eMarketer) predicts that ecommerce will grow "by double digits through 2027" and serve as "the driving force behind retail sales growth for the foreseeable future." The report also emphasizes that omnichannel strategies will become increasingly important, making reporting with greater attribution flexibility crucial for accurately tracking and attributing retail conversions.
With ecommerce now more of a standard than a novelty, marketers can turn to the Google Analytics reports, both Checkout Journey and Purchase Journey reports, to gain deeper insights into the customer's retail experience and improve those experiences accordingly.
Pierre DeBois is the founder and CEO of Zimana, an analytics services firm that helps organizations achieve improvements in marketing, website development, and business operations. Zimana has provided analysis services using Google Analytics, R Programming, Python, JavaScript and other technologies where data and metrics abide. Connect with Pierre DeBois: 
