Feature
Research Report
The 2026 State of CX Outsourcing

Analytics is often associated with online marketing as a way to measure visits to a website and online commerce. Yet as brands increasingly rely on apps and websites to entice customers, they are looking for advanced analytics solutions that will highlight how customers are being retained.
Enter customer churn analysis. A churn analysis is identifying customer segments who will likely stop doing business and attrition away.
Marketers are learning to incorporate churn analysis as part of a retention strategy. Leveraging techniques like decision trees can indicate where customer behavior should receive marketer attention.
Churn refers to the number of customers who stop using a product or service over a given period of time.
Customers churn for various reasons such as poor customer service, product dissatisfaction, price sensitivity, better alternatives and changes in circumstances, e.g. relocation. Churn can happen at any stage of a given customer acquisition funnel: Awareness, Acquisition or Engagement.
The goal of a marketing analyst is to identify the factors causing churn in data and make recommendations to prevent it. A churn analysis can determine which sequence of events in a customer experience leads to attrition and lost opportunities to increase sales.
At the Black Is Tech conference, I presented the following example using imaginary customer data from Kaggle, an open-source repository of data model projects. The data consists of customers and transaction information. The objective is to determine if a segment of customers would churn away from the bank.
The first step is to clean up the data: many times data has more columns than necessary or observations that are treated characters while the model needs to have those observations as numeric. Transforming the data is usually the answer to the clean-up needs.
The next step is to create a decision tree using R or Python. A decision tree is a dendrogram of nodes and leaves that clusters data according to conditions. The modes represent a condition that splits the data, while leaves are branches with each branch representing a node outcome. Think of an NCAA Final visualization, but going from the champion to the earlier competitors, and you are imagining a decision tree.
Decision trees are a kind of regression analysis. I wrote about regression analytics a few years ago, noting how marketers are using it to learn the relationships among customer data. A regression analysis examines your data to learn how to establish statistical relationships among the data variables. The key difference between regressions and decision trees is that while regressions estimate the correlation and magnitude of the variable relationships, decision trees provide influence based on the sequence of relationships.
Many analytics solutions include a visualization option for a decision tree. The most customizable options are created with open-source software, namely R programming or Python. There are libraries that can customize the tree nodes, such as the rpart and caret libraries in R programming and scikit-learn tree in Python. These also provide means to visualize the tree nodes and leaves. These are also often used for prediction analysis.
Training data forms the decision tree algorithm, which is applied to a new yet similar dataset. The end result is creating a prediction model for potential customer attrition that accommodates changing input data.
The last step in your customer churn analysis is to review the decision tree output to see if churn is identified among the data. The output is a dendrogram visualization. I am showing the one I created for my presentation. A dendrogram splits a given set of data into identifiable channels based on the conditions in the node.
In this case, the conditions are set by the columns in the dataset. The columns are treated as variables, and the underlying library calculates the threshold where the data can be split.
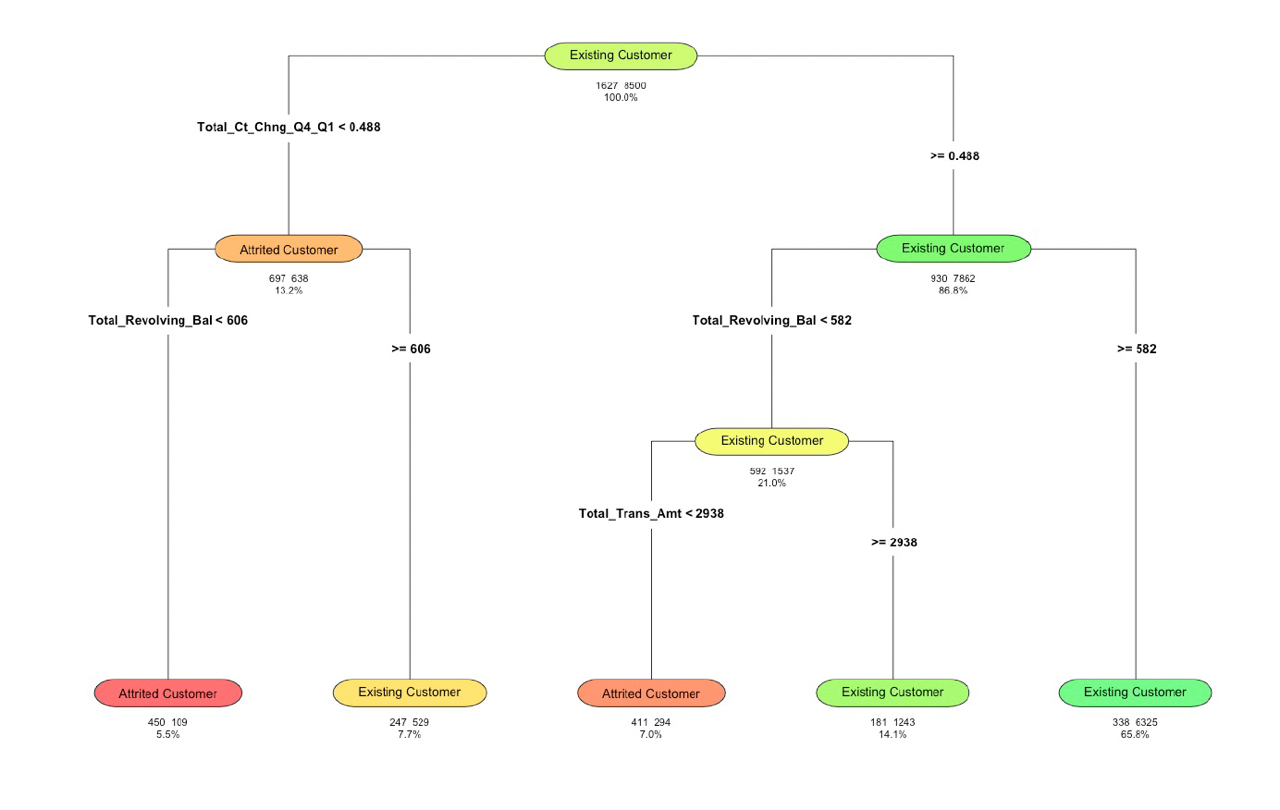
The display represents a form of clustering, displaying the number of customers at each node. If a churn happens, the last step is to indicate which groups are attritioning, and then make recommendations on how to best address the changes.
You can use generative AI solutions in a number of ways to craft a supporting decision tree in your churn analysis. For example, Claude can create a basic primer programming code for a decision tree. I am showing a super simple version – you can modify the prompt with details as needed.
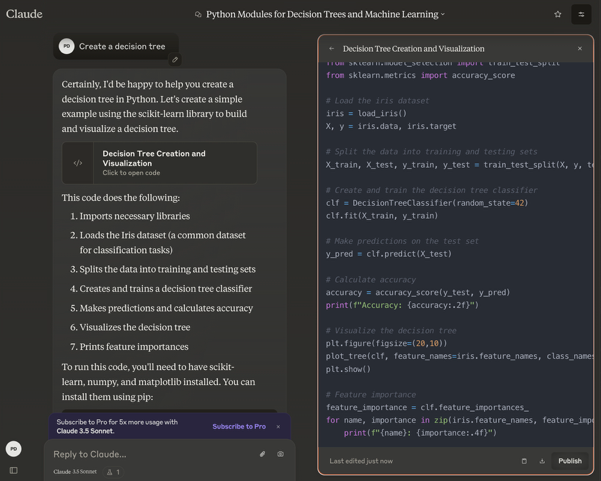
You can modify it to include your dataset, and then run it in an IDE – the software used to create a data model or dashboard app. This means asking your developer to review the code in Visual Studio Code, RStudio, or another IDE that can manage the language of choice.
If the data is not proprietary, you can even upload it into a generative AI app and prompt if a decision tree can be created.
Keep in mind any programming syntax should be checked to make sure it is operating correctly. The same goes for a prompt response. Doing so makes sure that the generative AI pot did not hallucinate a detail.
Also, consider creating a planning diagram to map out what you think the decision tree should look like. The Mermaid Editor is perfect for that purpose.
Related Article: 5 Ways Marketers Can Use Open Source Mermaid.js
Churn analysis is increasingly a valuable contributor to marketing strategy. Brands have begun to leverage subscriptions to deliver services and features to customers. Maintaining the subscription relationships relies on periodic analysis of which customer segments are being retained.
The analysis has become more crucial as marketing researchers discover the growing consumer attitude toward the rising cost of subscriptions. CNET reported an indication in its March 2024 survey that nearly seven in 10 (67%) US consumers saw at least one of their subscription services increase in cost. More than half of US adults have canceled a streaming service subscription because of increased pricing.
With concerns on expenses, it is easy to imagine how valuable a churn analysis would be to learn which customer segments are likely to attrition. Churn analysis brings immense value because it highlights opportunities to tailor subscription choices toward the right customer segments.
While churn analysis ultimately predicts the profitable customer segments, it is also a starting point with stakeholders to discuss how to better serve customer segments. Letting impacted teams know which kinds of customers will likely churn can save promotional budgets and direct resources to the best actions that will likely lead to improved sales.
The overall effect is having a better plan to support OKRs and meaningful KPI targets.
Pierre DeBois is the founder and CEO of Zimana, an analytics services firm that helps organizations achieve improvements in marketing, website development, and business operations. Zimana has provided analysis services using Google Analytics, R Programming, Python, JavaScript and other technologies where data and metrics abide. Connect with Pierre DeBois: 
