News
Research Report
Building the Case for Modern Public Sector Messaging


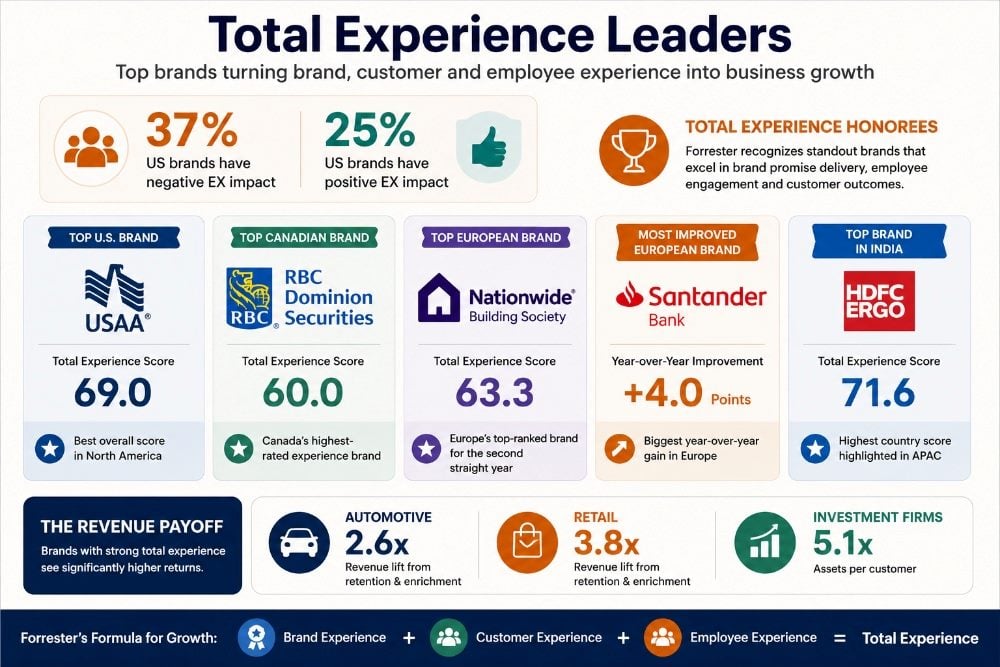
Forrester's employee experience numbers for brands aren't flattering. Among the 150 US brands Forrester evaluated with its new Employee Experience Index (EX Index) around its Total Experience research, 37% landed in the negative EX impact category. Only 25% were positive.
That means more than one in three American brands is actively undermining its own customer and brand experience efforts from the inside out.
Forrester's 2026 Global Total Experience Score Rankings evaluated 406 brands across 11 industries and 13 countries, drawing on more than 350,000 consumer perceptions. The Total Experience Score combines the firm's Customer Experience Index (CX Index), Brand Experience Index (BX Index) and, for the first time, the new EX Index into a single measure of a brand's ability to acquire customers, serve them and sustain customer loyalty.
Brands that align brand promise with customer delivery — what the firm calls a strong total experience — see significantly higher returns from retention and enrichment. In the US, automotive companies with strong total experience scores see a 2.6x revenue lift. Retailers see 3.8x. Investment firms see an assets-per-customer lift of 5.1x.
"Companies fuel business performance by focusing on two critical levers: shaping brand perceptions that earn trust and preference and delivering experiences that consistently bring that promise to life," said Keith Johnston, VP and group research director at Forrester. "When brand and customer experience are disconnected, they create conflicting signals and muddle their priorities. But when companies align their brand promise with the experiences they deliver, they create a compelling total experience, driving significantly higher revenue, retention, and customer value."
Editor's note: Forrester found that US brands delivering strong total experience — aligned brand promise and customer delivery — see substantially higher revenue from retention and enrichment across key industries.
| Industry | Revenue/Asset Lift | Metric Type |
|---|---|---|
| Automotive | 2.6x | Revenue from retention and enrichment |
| Retail | 3.8x | Revenue from retention and enrichment |
| Investment Firms | 5.1x | Assets per customer |
The EX Index is the headline addition to Forrester's 2026 rankings. It measures employee experience across three dimensions — empowerment, enablement and inspiration — and assigns each brand a positive, neutral or negative EX impact category based on public sentiment from current and recent employees.
The premise is straightforward: organizations depend on employees to design, deliver and sustain the experiences they offer customers. If employee experience is broken, customer experience is working against a headwind. The data bears that out. In the US, only one in four brands evaluated had positive EX impact. In Canada, the picture was somewhat better — 36% positive, 11% negative. European brands fared better still, with 40% in the positive category and 20% negative.
Forrester will also recognize standout performers through its inaugural Total Experience Honor, selecting organizations from each region — Asia Pacific, Europe and North America — that demonstrate brand promise delivery, employee engagement and measurable customer and business outcomes.
Related Article: Marketing Promised. CX Didn't Deliver. Here's the Cost.
The regional results for North America were broadly positive. Among US brands evaluated in both 2025 and 2026, 53% increased their Total Experience Scores, 4% saw declines and 43% had no change. Canada mirrored that split almost exactly — 53% improved, 1% declined, 45% held steady.
But the source of improvement in the US tells a more complicated story. Score increases were driven primarily by noncustomer perceptions — 48% of noncustomer scores improved versus only 28% of customer scores. Brands got better at being perceived. They didn't get nearly as much better at being experienced.
That's the same tension Forrester surfaced a year ago, now with a year's worth of additional data behind it. The gap between brand promise and customer delivery remains the defining challenge for CX leaders, even as overall scores move in the right direction.
The highest-scoring US brand was USAA as a bank, with a Total Experience Score of 69.0. In Canada, RBC Dominion Securities topped the rankings at 60.0. At the industry level in the US, hotels posted the highest average score (61.7), while auto and home insurers showed the biggest year-over-year improvement, gaining 4.5 points. In Canada, investment firms led both average score (55.3) and year-over-year gain (+3.5 points).
Editor's note: Forrester evaluated brands in both 2025 and 2026 to determine year-over-year Total Experience Score changes across the US and Canada.
| Market | Brands Improved | Brands Declined | Top Brand | Top Industry (Avg Score) | Most Improved Industry |
|---|---|---|---|---|---|
| United States | 53% | 4% | USAA – Banking (69.0) | Hotels (61.7) | Auto & Home Insurance (+4.5 pts) |
| Canada | 53% | 1% | RBC Dominion Securities (60.0) | Investment Firms (55.3) | Investment Firms (+3.5 pts) |
European brands were largely stable. Of the 78 brands evaluated across four industries and eight countries, 83% saw no statistically significant change in their Total Experience Score, 17% improved and none declined. Nationwide Building Society in the UK held the top spot for the second consecutive year with a score of 63.3. The most improved brand in the region was Santander Bank in Spain, which gained 4.0 points.
Asia Pacific told a more uneven story. Overall, 83% of brand scores were unchanged, 9% improved and 9% declined. Improvements were confined to Australia and India. All declines occurred in Singapore, where investment firm and health insurance industry averages dropped 1.5 and 1.7 points respectively. The highest-scoring brand in each country: Bendigo Bank in Australia (54.7), HDFC ERGO in India (71.6) and DBS as an investment firm in Singapore (61.8).
Forrester plots each brand on a growth grid across two axes — how well they win noncustomers and how well they serve existing customers. The quadrant a brand occupies has direct strategic implications.
Leading brands score high on both axes. Their prospects trust them and their customers are eager for continued engagement. Plateauing brands score well with customers but poorly with prospects — strong today, potentially starved of new revenue tomorrow. Churning brands attract prospects but fail to retain them, a particularly costly position when acquisition costs are high. Lagging brands score poorly on both dimensions.
What have we seen?
Siloed customer experience, employee and brand experience programs are a liability. Unified measurement and coordinated governance now separate high-performing enterprises from the rest.
A 10% increase in employee commitment can drive a 22% increase in customer spending. Yet most organizations still manage CX and EX through separate teams, metrics and priorities.
That coordination failure surfaces as poor customer outcomes. As one analysis framed it: customers experience the service in the cabin, but its quality depends on decisions coordinated in the cockpit.
Forrester's introduction of the Brand Experience Index at its 2025 CX Summit signaled a structural shift in how enterprises measure experience. Aligning brand promise with delivery across touchpoints is associated with up to 3.5x revenue growth.
Traditional retrospective metrics fall short for total experience programs. Familiar measures like net promoter score and customer satisfaction score are giving way to broader frameworks. The Experience 5.0 framework calls for expanding measurement to include:
A practical framework for operationalizing unified experience measurement:
Organizations with strong CX leadership and stakeholder alignment show greater agility when responding to changing expectations. Platform consolidation reflects this pressure, as seen in Netigate's acquisition of Mopinion to unify customer and employee feedback analytics.
 Have a tip to share with our editorial team? Drop us a line: