Editorial
On-Demand Webinar
Do More with Less: Modernizing the Cloud Contact Center

The art of crafting analytics dashboards goes far beyond displaying metrics on a screen. For marketing managers responsible for customer experience, these dashboards become the primary vehicle for translating customer data into actionable stories that drive business decisions and experience improvements. This is particularly true for marketing managers leading teams within a startup or an organization’s sub-brand.
Unlike enterprise organizations with dedicated data teams, startup marketing managers must build dashboards that serve multiple stakeholders while operating under more specific budget constraints. As my recent exploration of data storytelling for customer experience emphasizes, the most successful approaches don't just report what happened—they tell the story of why it happened and what to do next.
In the startup environment, data storytelling through dashboards has become crucial for a startup’s success in the marketplace. Marketing managers must quickly identify which customer experience initiatives drive growth and which drain resources without delivering results.
Traditional enterprise dashboards often focus on comprehensive reporting across multiple departments. Startup dashboards, however, must tell a focused story about customer acquisition, activation, and retention that directly ties to revenue and growth objectives.
The integration of AI capabilities into analytics dashboards has transformed how startups can compete with larger organizations. As noted in my recent analysis of modern data storytelling trends, AI-powered tools like advanced analytics platforms can handle more observations and provide creative solutions for customer experience optimization—capabilities that were previously exclusive to enterprise-level teams.
For startup marketing managers, AI-enhanced dashboards level the playing field by providing enterprise-level insights with startup budgets and team sizes.
Effective startup dashboards follow a structured narrative approach that connects customer data to business outcomes. Each dashboard element should contribute to a cohesive story about customer experience and growth opportunities.
Five essential components for building dashboards that tell compelling customer stories.
| Framework Component | Objective | Startup-Specific Focus |
|---|---|---|
| Connect Customer Data to Growth Outcomes | Identify metrics that directly impact revenue and retention | Focus on leading indicators that predict customer lifetime value |
| Map Metrics to Customer Journey Touchpoints | Organize data around customer experience stages | Prioritize activation and retention over vanity metrics |
| Choose Visualizations That Drive Action | Select chart types that highlight critical patterns | Emphasize trend analysis and comparative performance |
| Leverage AI to Accelerate Insights | Implement predictive analytics and automated pattern detection | Use AI to identify customer segments and predict behavior |
| Make Recommended Actions Clear | Ensure every metric has associated response protocols | Connect insights to specific optimization opportunities |
Related Article: Customer Touchpoints: The Key to Unifying the Customer Journey
Begin your dashboard design by identifying the critical questions your startup needs to answer. These questions should directly relate to customer experience improvements that drive business growth.
The most effective startup dashboards demonstrate clear connections between customer experience metrics and business performance. Rather than displaying isolated statistics, your dashboard should show how addressing specific customer friction points impacts revenue, customer retention and growth.
For example, instead of simply tracking "time to first value," your dashboard should connect this metric to 30-day retention rates and show how reducing time to value by X days increases customer lifetime value by Y dollars.
Related Article: What Is Customer Lifetime Value and How Is It Calculated?
Startup dashboards excel when they organize metrics around customer journey stages rather than internal departmental silos. This journey-based approach transforms disconnected data points into a coherent narrative about customer experience.
Key performance metrics mapped to each stage of the customer journey, with AI opportunities for startups.
| Journey Stage | Primary Metrics | AI Enhancement Opportunities |
|---|---|---|
| Acquisition | Cost per acquisition, conversion rates by channel, source quality scores | Predictive channel performance, automated attribution modeling |
| Activation | Time to first value, onboarding completion rates, feature discovery | Personalized onboarding paths, activation probability scoring |
| Engagement | Daily/weekly active users, feature adoption depth, session quality | Behavioral pattern recognition, engagement prediction models |
| Retention | Cohort retention curves, churn probability, product stickiness | Churn prediction algorithms, retention improvement recommendations |
| Expansion | Upsell conversion rates, feature upgrade adoption, account growth | Revenue expansion predictions, customer success scoring |
Map your dashboard metrics to specific customer touchpoints where experience improvements can drive measurable business impact. This approach helps identify which optimizations will have the greatest effect on customer satisfaction and business growth.
Startup dashboard visualizations must prioritize immediate comprehension and actionability over aesthetic complexity. Marketing managers need to quickly identify trends, outliers and opportunities without spending time interpreting complex charts.
Effective dashboard storytelling requires a combination of technical skills and strategic thinking. As outlined in this framework for data storytelling, several complementary skills enhance your ability to craft impactful dashboards:
Skills and tools that enhance storytelling impact for startup dashboards.
| Skill or Tool | What It Supports | Startup Application Example |
|---|---|---|
| Data Framing | Crafting questions that align with business objectives | Reframing churn rates as early warning signals for revenue impact |
| Contextual Enrichment | Adding situational awareness to raw data | Explaining conversion dips due to product changes or market conditions |
| Sentiment Analysis | Extracting emotion and tone from customer feedback | Analyzing support tickets to predict customer health scores |
| Visualization Literacy | Translating data into stakeholder-friendly formats | Choosing cohort heatmaps vs. line charts for retention analysis |
| AI-Assisted Exploration | Scaling analysis with speed and pattern recognition | Using predictive models to surface customer behavior anomalies |
Remember that startup teams often access dashboards on mobile devices. Ensure your visualizations remain clear and actionable on smaller screens.
AI integration transforms startup dashboards from reactive reporting tools into predictive customer experience engines. These capabilities enable small teams to compete with larger organizations by surfacing insights that manual analysis would miss.
Recommended tools for startups across different levels of AI maturity.
| Platform Category | Recommended Tools | Key AI Features |
|---|---|---|
| Entry-Level AI | Google Analytics 4, Mixpanel | Automated insights, anomaly detection |
| Mid-Tier Solutions | Amplitude, Segment Personas | Predictive analytics, intelligent segmentation |
| Advanced Platforms | CustomerAI, Gainsight PX | Custom ML models, advanced predictions |
Your startup dashboard should end each story with specific, actionable recommendations. What customer experience improvements should be prioritized? Which metrics indicate the need for immediate intervention? What experiments should be launched based on current trends?
Clear Action Triggers:
Recommended Action Examples:
Connect your dashboard insights directly to customer experience improvement workflows. This integration ensures that data insights translate into meaningful customer experience enhancements rather than remaining isolated observations.
Related Article: Customer Experience Automation: Beyond the Basics
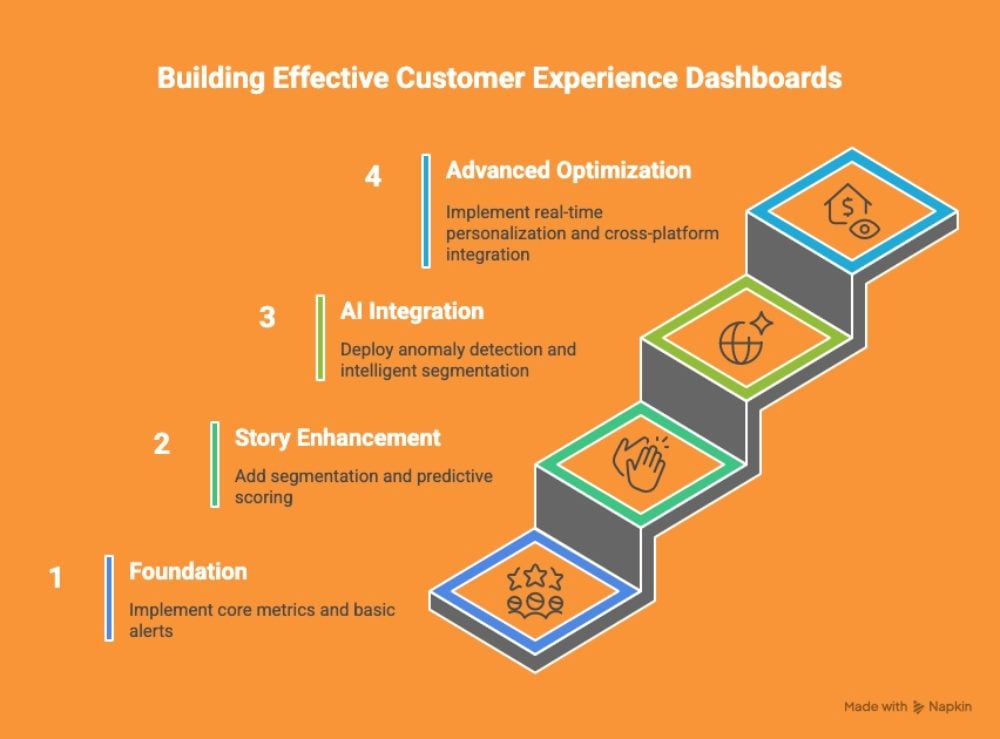
Startup marketing managers must build effective customer experience dashboards while balancing budget constraints and competing priorities. This phased approach ensures steady progress without overwhelming team resources.
Each phase can usually take a few weeks to complete tasks, with the optimization tasks in Phase 4 treated as ongoing maintenance.
Track the effectiveness of your dashboard storytelling approach through these key indicators:
Adoption Metrics:
Business Impact Metrics:
By following this framework, startup marketing managers can build analytics dashboards that do more than display data—they tell compelling stories about customer experience that drive meaningful business growth and competitive advantage.
The key to success lies in starting with customer-focused questions, organizing metrics around the customer journey, and leveraging AI to surface insights that inform immediate, impactful actions. Remember: the best dashboard is one that transforms customer data into customer success.
 Learn how you can join our contributor community.
Pierre DeBois is the founder and CEO of Zimana, an analytics services firm that helps organizations achieve improvements in marketing, website development, and business operations. Zimana has provided analysis services using Google Analytics, R Programming, Python, JavaScript and other technologies where data and metrics abide. Connect with Pierre DeBois: 
